Before the summer, the Geronimo.AI team has completed a six week project for ProRail, the Dutch organisation that takes care of the maintenance of the railway infrastructure. The actual maintenance of rail sections is however tendered to subcontractors. It is important in this tendering process that it is known which and how many assets are present in a certain rail section. If mistakes are made, ProRail will be penalised.
During the 180 years of history of railway tracks in the Netherland, complete and accurate locations of the assets are difficult to maintain. This is because the location of an asset in the construction plan can differ from the actual location of the asset. To know the exact location of an asset, the asset can be ‘measured in’ on location. However it is expensive to do this every year on every asset. Therefore, ProRail is investing in methods that use machine learning to digitise the location of their assets.
Aerial images of the entire Dutch railway infrastructure are made using helicopters. This high definition image is the data source for this project. The assets which are decided to be located are relay boxes, which are located next to ES-welds in the rails. The aim of these boxes is to measure when a train is present on a certain part of the rails. However, the tool to build is also able to detect other assets when properly trained.
The plan
With all the pictures taken by the helicopter comes a location of where the picture is taken. A useful format to store these pictures is the TIFF format, which places the pictures on the right location in a georeferenced frame. When combining all the geotagged pictures, the entire Dutch railway network is visible in one giant picture. To scope the problem, it was decided to take two portions of the entire TIFF file: roughly the Province of South Holland and a portion between the cities of Tiel and Nijmegen. When the model is performing well enough, it can be used to find the relay boxes in the remainder of the Netherlands.
The plan was as follows:
- Create subwindows in the TIFF file
- Label which windows contain a relay box
- Train a neural network on the data set
- Assess the performance of the model
Window creation and labelling
For practicality, the complete area that is part of this project is firstly divided into eight zones. Next, methods were developed to efficiently sample windows from the TIFF files possible to state whether a relay box is present in a window or not. To help us find the boxes, ProRail has provided us with two data sources: one that is inaccurate but contains a large portion of the boxes and one that is very accurate but contains only a small portion of the boxes.
After labelling, three categories are created:
- Windows that include relay boxes
- Windows that do not include relay boxes, but do include rail tracks
- Windows that do not include relay boxes, and do not include rail tracks
It is decided to also make a segregation between windows with and without rail tracks as the relay boxes are always located next to the rails. This makes it unnecessary to inspect windows that are further away from the rail tracks and it is therefore better to exclude them. Shapefiles, or geospatial vectors, of the rail tracks are used to identify the windows that include rail tracks.
An example of how a certain part of the TIFF files looks like is shown in Figure 1. The windows are indicated by black boxes, which are coloured in blue, green and red. Blue corresponds to category 1, green to category 2 and red to category 3. Intuitively explained, green windows show the trajectory of the rails and clusters of blue windows are present where relay boxes are present.
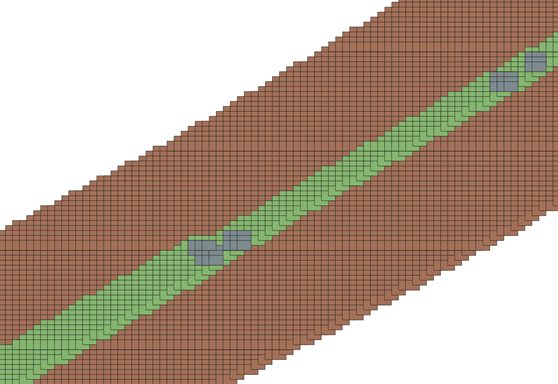
Figure 1: Part of the TIFF file with the windows indicated. The three categories are indicated by blue, green and red, respectively.
A complicating factor was found to be that there are multiple types of relay boxes. This makes it harder for the model to be trained to identify all these types with the same number of labels. Labels are created for 1215 instances of the main type, called “tweewittekastjes”, which form 60% of the entire set of all types of relay boxes. It is therefore decided to train a separate model for this main type, next to a model that aims to find all types of relay boxes.
Change of plans
A convolutional neural network was chosen to be used as a model to find the “tweewittekastjes” and a bespoke network to find all types of boxes. The first results showed a meager performance which was investigated by looking at the windows, see Figure 2.
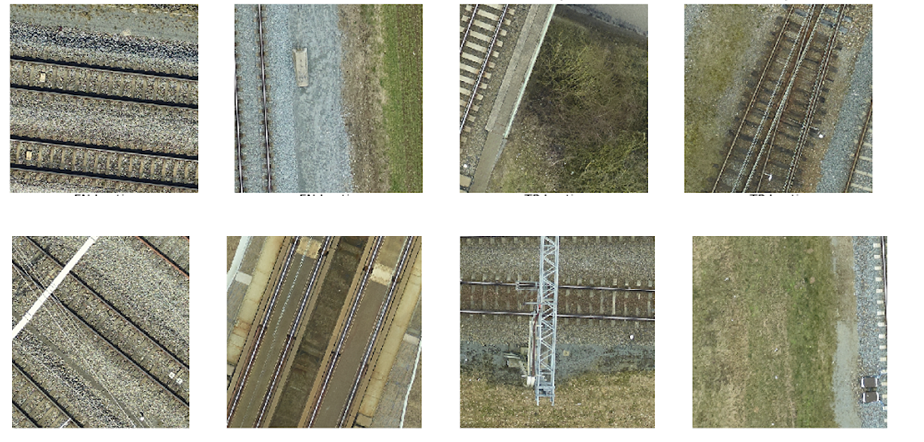
Figure 2: Windows containing tracks.
What becomes apparent from Figure 2 is that it is hard for a human to orientate as the tracks are arbitrarily aligned. As a neural network is inspired by the human brain, hence the term artificial intelligence, it will also be hard for the network to “orientate”. The variation in the input data can be greatly reduced if the windows are aligned with the rails, resulting in a higher signal to noise ratio, making it easier for an algorithm to detect relay boxes.
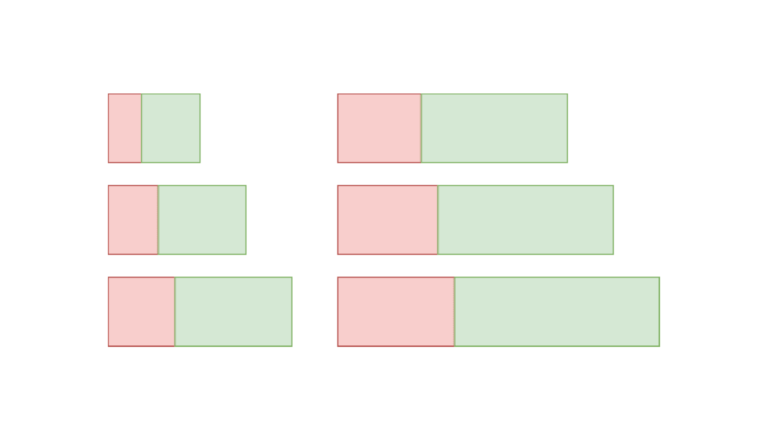
The decided approach is to align the window orientation with the rail tracks, for which the shapefiles of the tracks are used. As the boxes are always next to track, this also increases the chance that the boxes are located in the middle region of the window, what is desirable for an accurate identification. The resulting windows are visible in Figure 3, with the windows that include boxes in purple and the ones without in red.
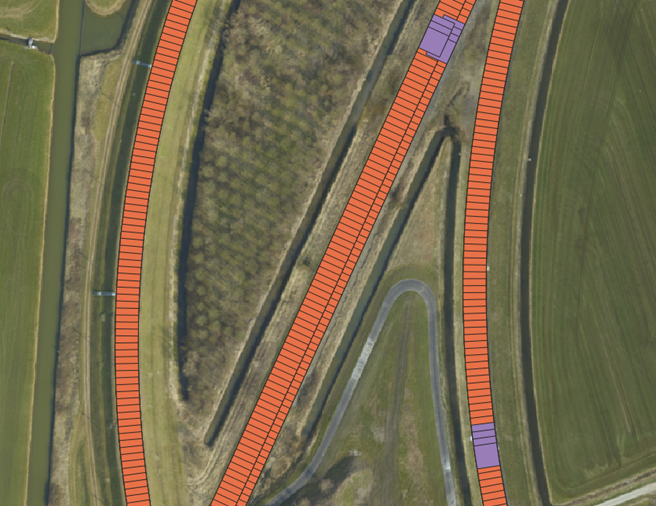
Figure 3: Windows aligned with the rail tracks.
An example of the resulting windows are visible in Figure 4. They are indeed a lot more structured and intuitive than the windows in Figure 2. Let’s see what the model can do with them!

Figure 4: Aligned windows.
The final step
As there are a lot more windows without boxes than there are with boxes, an adjustment in the way the network is trained has to be made. A higher penalty should be given when the network identifies a window with box to be containing no box. Since there are a lot more windows with no box, the network is otherwise inclined to identify all windows as windows with no box. If a higher penalty is given when a false negative is obtained, this decision is more balanced. Accordingly, this method is called rebalancing.
Results
The results of the convolutional neural network model which focuses on the “tweewittekastjes” will be discussed now. Examples of true negatives (TN), false negatives (FN), false positives (FP) and true positives (TP) are shown in Figure 5. Starting with the true negatives and true positives, it can be seen that in these cases the windows without and with boxes are accurately determined.
Then we turn our attention to the false negatives. In the first four pictures, there are indeed relay boxes present but the network has not identified them. The rule applied here is that a window should be marked as positive when more than half of a box is present. The cases where a box is cut by the edge of a window are more difficult for the network to recognise. Taking a step back to the bigger goal of locating relay boxes, this is not such a big issue as these boxes are captured by the neighbouring windows, since the windows overlap. In the most right picture of FN, the relay box is situated underneath a structure carrying the electricity cables, making it hard to recognise.
Finally, the first false positive shows a rail switch, and not a relay box. Although you might understand that the model captures this incorrectly. In the second picture, the relay boxes are situated next to the neighbouring track, and therefore should have been identified in the corresponding window. In the final three pictures, the relay boxes are indeed present. They are marked as false positive as the labels were missing here. You could therefore state that the network does its job: finding relay boxes which are missing from the record!

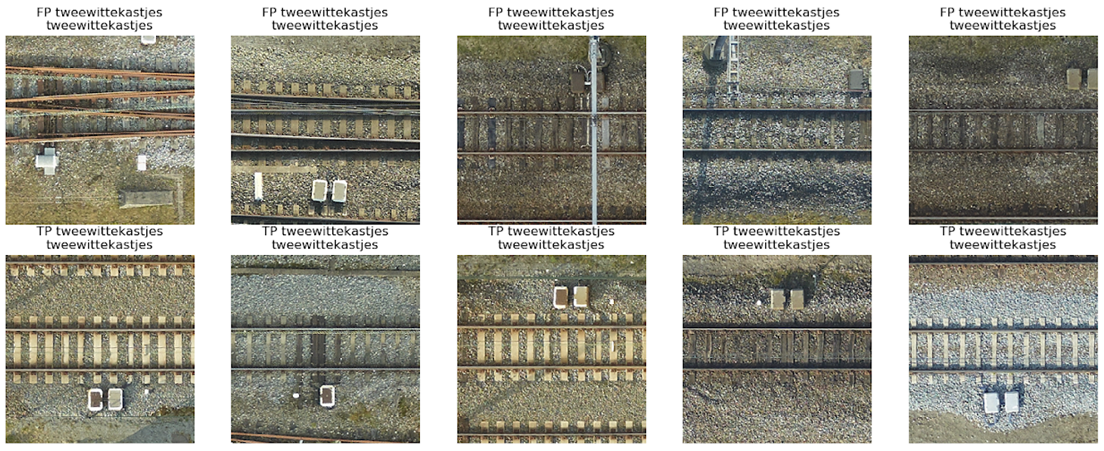
Figure 5: Examples of true negatives (TN), false negatives (FN), false positives (FP) and true positives (TP) for the model which focuses on the “tweewittekastjes”.
Conclusion
The network for the “tweewittekastjes” is seen to be performing well with a precision of 0.77 and a recall of 0.96, resulting in a better performance than the network that was trained on all the classes. These are satisfying numbers and shows that this approach can be a suitable tool for aiding in the problem of finding relay boxes. It is expected that the performance will improve when investing more time on model optimisation, for which was limited time due to the short timeframe of the project. Furthermore, the difficulty of the different type of boxes makes the problem a lot more difficult such that more data is required to train the network to a higher level. To conclude, it can be stated that the data pipeline can be applied to problems of finding different assets, such as railway switches.

![On satellites, growth curves and the birth of the Crop Detector [2]](https://geronimo.ai/wp-content/uploads/2019/05/blog2-min-768x441.png)