Welcome to the third and final blog in the Naive Bayes for text classification series. So far we worked through the theoretical derivation of the classifier in blog 1 and in blog 2 we saw that the Naive Bayes classifier did a great job at classifying, reaching an accuracy of over 90%. However, this accuracy was achieved on a perfectly balanced dataset. Today we’ll investigate the performance on unbalanced datasets. The investigation is split up in two parts:
- How does the ratio of negative/positive reviews influence the performance?
- How does the number of reviews influence the performance?
Influence of the ratio
To answer the first question, a set of experiments is designed where the total number of reviews is kept constant at 25,000, while the ratio between good and bad reviews is varied. So the number of negative reviews is given as 25,000*r and the number of positive reviews is given as 25,000*(1-r), where r is varied logarithmically between 0.01 and 0.5.
Furthermore, we consider N-grams and calculate the performance metrics using five-fold cross-validation. The mean recall and precision for both the positive and negative class are plotted against the ratio of the dataset in the figure below. Furthermore, the min and max of the five folds are plotted as well, to give an idea of the distribution of the metrics over the folds. The results are presented in Figure 2.
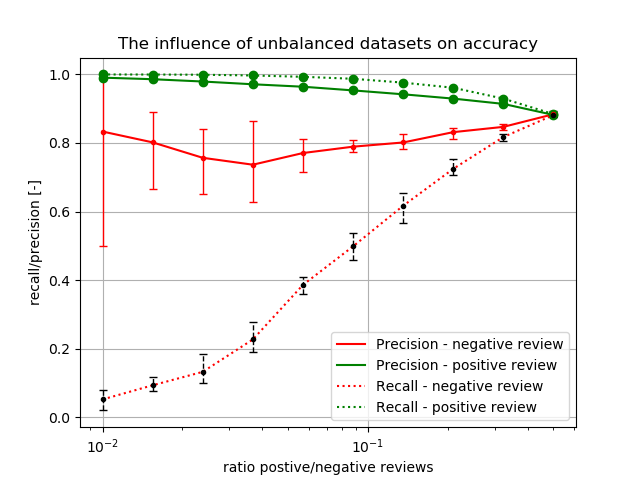
We can observe the following:
- As the ratio increases and more negative reviews are present, the precision and recall of the negative reviews increase, while the metrics of the positive reviews decrease. This is expected behaviour; when the ratio increases, the Naive Bayes classifier is trained on more negative reviews and thus has more features to draw on. Which in turn, yields better performance.
- One fold, at a ratio of 0.01 achieves a precision of 1. Precision for the negative class is defined as TN/(TN+FN), hence a precision of 1 essentially means that a classifier trained on the unbalanced data set did not classify any positive review as negative. This is also expected as there are only 250 negative reviews in the dataset.
Influence of the dataset size
To investigate the impact of the amount of data on the performance of the Naive Bayes classifier, a more complex experiment is designed. Verifying a classifier on a small data set does not give us a lot of information and it is more interesting to measure its generative capabilities. Therefore, the dataset is split up in a train set of 20,000 positive and negative reviews and a validation set of 5,000 positive and negative reviews. Furthermore, we now define the ratio as the number of negative reviews relative to respect to the positive reviews and we’ll vary the amount of positive reviews, while keeping the ratio fixed. In doing so, we create various datasets with the same ratio of negative to positive reviews while varying the total number of reviews taken from the training dataset of 40,000 samples. Furthermore, we ensure that the validation set has the same ratio as the training data set.

Let’s elaborate with an example. If we design an experiment with ratio 0.05 and number of positive reviews is 200, we sample a training data set of 200 positive reviews and 200* 0.05 = 10 negative reviews from the big training set of 40,000 reviews. The validation set is randomly sampled with 5,000 positive reviews and 0.05 *5,000 = 250 negative reviews from the big validation set of 10,000 reviews. The trained classifier is first five-fold cross-validated on the training data after which all five trained classifiers are analysed on the validation set.
The experiment considers df_min = 5, df_max = 10,000, ngram_range = (1, 3) and alpha = 0.1. The results for the ratio of 0.05 on the test and validation set are presented in Figure 4 and 5 respectively.
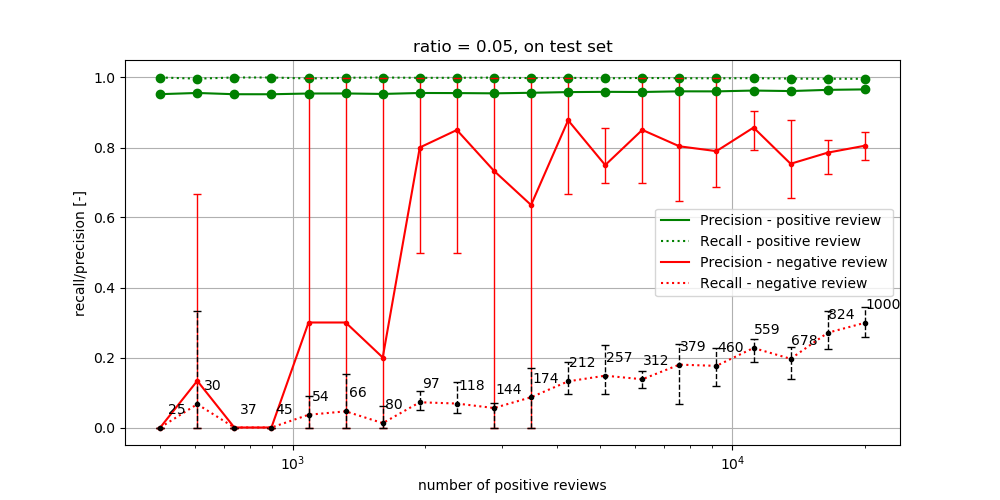
We can observe the following from Figure 4:
- The precision of the negative class reaches both 0 and 1. Precision is given as TN/(TN + FN), which reaches zero once there are no false negatives and/or true negative. The maximum precision at 54 negative reviews is 1; although this sounds very impressive, this can already correspond with correctly classifying one negative review and never classify a positive review as negative review resulting in 1/(1+0) = 1.
- We also see occurrences of a recall of 0. As recall is defined as TN/(TN + FP), this essentially means the classifier fails to classify any review as negative.
- As the number of the training dataset increases, the precision of the negative class increases. Furthermore, we see that the recall increases however, less significantly. The difference in both metrics are the false positives and false negatives. You can imagine that a classifier that saw way more examples of positive reviews is more biased to classifying reviews as positive. Hence, the occurrence of a negative review classified as positive (false positive) is more common than a positive review classified as negative (false negative), which explains the difference in precision and recall. This also explains why the folds have less impact on the recall than on the precision.
- Looking at the positive reviews we can see first of all, that both precision and recall are high and secondly, that they are barely influenced by the data set size.
Precision and recall for the positive class are defined exactly the other way around. Precision = TP/(TP + FP) and recall = TP/(TP + FN). As we argued under bullet point 3, false negatives rarely occur and true positives are really common. Thus, TP >> FN and therefore recall is close to 1. As the data scales with the same ratio, the assumption TP >> FN holds for larger datasets and therefore the recall stays 1. In the situation that the recall and precision are both 0 for the negative class we can easily calculate the precision for this use case. As we argued earlier, a precision and recall of 0 for the negative class means the classifier did not classify any negative as negative (TN = 0) nor did it classify any positive review as negative (FN = 0). This now means that TP + FP = N, where N is the size of the data set. This also means that FP is equal to the number of negative reviews defined in this case as 0.05*Npos whereas TP is equal to the number of positive reviews Npos. Hence, precision = TP/(TP + FP) = Npos/1.05*Npos = 0.9524 independent of the size of true positives. With poor performing classifiers trained on small unbalanced datasets you can image that FP ≈ Nneg and therefore the precision does not change much as the data size increases.
Now let’s analyse the classifiers on the validation set of which the results are presented in Figure 5.
- Classifiers trained on small portions of the training data, which did not manage to correctly classify any negative review on their test set, are able to obtain positive recall scores on the larger validation set.
- The classifiers trained on the largest unbalanced dataset reaches a recall of 0.3 and precision of 0.79 for the negative class, which is not very high.
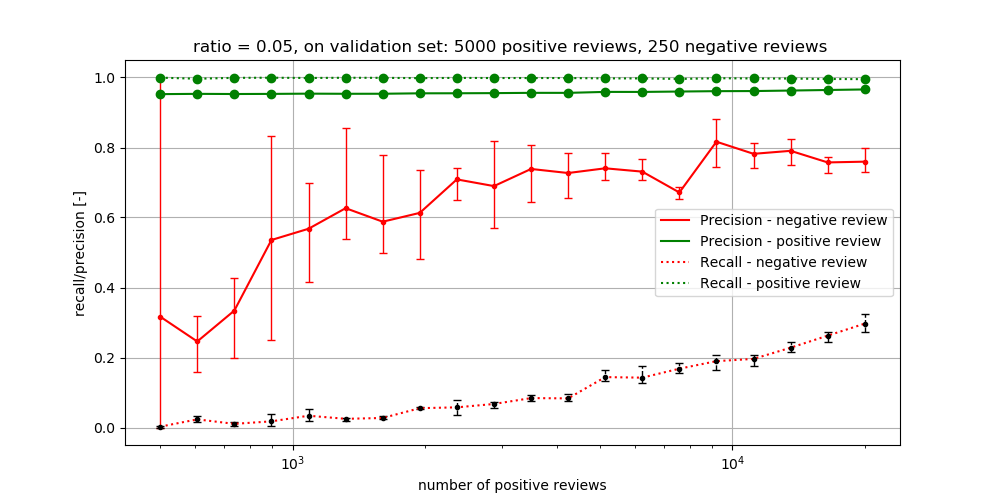
Figure 5: The precision and recall for increasing datasets with a ratio of 0.05 on the validation set